Jose's Blog

14.01.2021

Setting up Maple for startup code and for saving all data of the worksheet.

Filed under: Computer Math,Programming — Tags: — admin @ 15:53

This is about setting up maple so that:

  1. You can load your libraries from a customized location.
  2. You don’t have to execute the whole worksheet to get an old computed result.

I only know this for Windows, for linux this should be the same but probably easier. I had some problems in Maple for Windows because it changed the way it processes the .ini file without correctly documenting it. They kept an old documentation of the .ini file but the location of the .ini file should be corrected:

https://www.maplesoft.com/support/help/Maple/view.aspx?path=libname
https://www.maplesoft.com/support/help/Maple/view.aspx?path=worksheet/reference/initialization

In the past, in Windows, .ini was saved in %APPDATA%/Maple/<version>/maple.ini . This file still exist for newer maple version but it is not the same initialization file of the past (where you can write a startup code). The newer versions of Maple (I believe > version 16) uses this .ini file for the UI and not for startup code. However (undocumented) Maple will read another .ini file for startup, which unfortunately is also called maple.ini but located somewhere else. The startup code maple.ini file is now located in %USERPROFILE% (e.g. C:\Users\Jose). If this directory has no maple.ini, I suggest to create one.

Now if you want to have a startup code that:

  1. uses a customized location (for the sake of simplicity we want them to be in C:\my_libs) for libraries, put this in the init file:
    libname:="C:\\my_libs",libname:
    savelibname:="C:\\my_libs":
    
  2.  provides a procedure that saves all user variables from a worksheet (this is useful if you have something that computes for ages and whenever you open maple again you want to have the results). Put this in the maple.ini file:
    SaveAll := proc( fileName :: string )
    subs(_NAMES = anames(':-user'), proc() save _NAMES, fileName end proc)()
    end proc:
    

So now whenever I do some heavy computation in a worksheet before closing the worksheet I always type something like

SaveAll("C:/temp/maple.m");

And now when I open the worksheet again and I don’t want to re-execute the computation but still have the same variables I type
read("C:/temp/maple.m");

22.11.2016

Mathematica and me

Filed under: Computer Math,Programming,Tutorial — Tags: — admin @ 11:50

$
\newcommand\R{\mathbb{R}}
$
The last time I think I was serious with Mathematica was 2001? or maybe a few years earlier. I really cannot remember. But I left it and always looked at Maple for enlightenment (where I was/am not still good at). In the past when I looked at Mathematica I thought of it as a Maple similar and probably any amateur would still believe this to be. Both very clumsy to work with. Now, 2016, they differ so much and have advanced so much. One is good at one thing, the other at another. But this is not a debate which is better. This is a “tutorial” what you can do a little good with one. Today Mathematica won my heart (another day it could be Maple). Because the topic “Cylindrical Algebraic Decomposition” (which we in the real world, i.e. real algebraic geometry world, just simply call “cylindrical decomposition”) expresses the strength of Mathematica.

A Mathematica code is a bit different from a C++ code (or even Maple) that I am more used to. So let me list down some things I (think I) learned during the coarse of a few days looking at one or two codes:

  • f @ something means apply f to x
  • f /@ {a,b,c} means {f[a],f[b],f[c]}
  • f @@ List[...] means change List to f
  • f @@@ List[List[...]] means List[f[...]]

The first problem that I had is the following: Given an real algebraic set defined by a polynomial function $f:\R^m\rightarrow \R$ , find the number of connected component of the complement of this set. Also find an “algorithm” that can tell if two elements in $\R^m$ belong in the same connected component.

For the sake of argument I took $m=2$ and variables to be $x$ and $y$. Then I wanted to find the connected components of all those $(x,y)$ for which $f(x,y)\neq 0$. To this I copied and modified a code from a mathematica stackexchange post and the modified code looks like this

Coco[eqns_, xrange_: {x, -1, 1}, yrange_: {y, -1, 1}, 
  plotit_: False] := 
 Module[{decomp, connected, regconn}, 
  regconn = 
   Resolve@Exists[{x, y}, (x | y) \[Element] Reals, 
      RegionMember[
       RegionIntersection[ImplicitRegion[#1, {x, y}], 
        RegionBoundary@ImplicitRegion[#2, {x, y}]], {x, y}]] &amp;;
  decomp = 
   List @@ BooleanMinimize@CylindricalDecomposition[eqns, {x, y}];
  connected = 
   Or @@@ ConnectedComponents@
     Graph[decomp, 
      UndirectedEdge @@@ 
       Select[Subsets[decomp, {2}], 
        regconn @@ # || regconn @@ Reverse@# &amp;]];
  Print[&quot;number of connected components: &quot;, Length@connected];
  If[plotit,Print[
    (Quiet@
         RegionPlot[#, xrange, yrange, 
          PlotPoints -&gt; 100] &amp; /@ {decomp, connected})~
     Join~{FullSimplify[connected, (x | y) \[Element] Reals]}]]; 
  Return[connected]]

As you can see the code just simplifies the regions defined by cylindrical algebraic decomposition using disjunctive normal form and then finds the regions of intersection by identifying each region as a vertex of a graph and then connecting the vertices if they have common intersections. Then Mathematicas (quit powerful) graph theory package can figure out the connected components of the graph and thus identify exactly the connected components of the Zariski open set defined by the complement of the hypersurface. This, I think, is an overkill. You really need not convert everything into a graph and use Mathematica’s connected component procedure for graph. You just need to use pigeon-hole principal by placing each region in a set containers and iteratively by order fill the set containers depending on common intersection of region or make a new container if there is no existing set container having region with common intersection. Since I was/am a lazy animal and the procedure was fast enough for my purpose, I left it as it was.

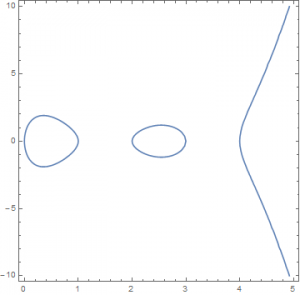
I tested this on a curve for which I knew how many connected components it’s complement have, namely the curve $y^2=x(x-1)(x-2)(x-3)(x-4)$ the plotof which looks like this:
curve_4_coco

After applying the Coco on the curve by typing (the three other parameters in Coco are optional, they are only used to plot the regions)

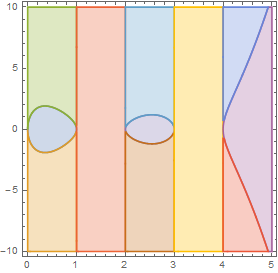
connected = Coco[y^2 != x(x-1)(x-2)(x-3)(x-4),{x,0,5},{y,-10,10},True];

I get the picture for the cylindrical algebraic decompositions

the picture of the different components

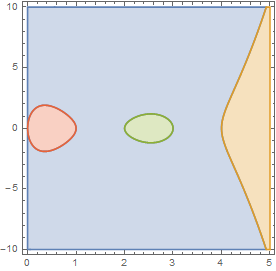
the number of components and the actual regions given (click to see in full glory)

The counting of component for this function, without plotting, took around 6.7 seconds in my not-so-fast laptop. Understandably, most of the time was sucked by the plotting. The plotting does not concern me a lot so I am happy with this. I think it can even be made faster (I predict, with correct coding and optimization you can squeeze it to 2 seconds).

Hopefully, in a future post I will show how this is done (with less pictures) when the hypersurface lies in a space with dimension greater than two (i.e. $m>2$).

19.07.2016

multiple screensaver randomized at a time interval

Filed under: Programming — Tags: — admin @ 11:50

Anyone who worked with linux might be more familiar with XScreensaver. It was only late when I got myself familiar with it. But I was also quite annoyed that I didn’t had this possibility of using multiple screensaver that changes at a fixed time interval, say every 1 minute, alone on the first call of the screensaver by a Windows operating system. I think there is the possibility for a software to change the default screensaver to another random screensaver, but what I wanted was XScreensaver style in windows. I wanted one call of screensaver uninterrupted by the user input to change to another screensaver while the computer is still idle after a specific time interval.. and I wanted randomness as well. I searched high and low and found ScreenMonkey from the WWW. I think it has some .NET dependencies. In any case, I was a bit annoyed that I had to pay for it in order to get rid of the monkey between screensavers. It didn’t bother me that much, but I was still challenged to solve the problem on my own by making my own multiple screensaver randomizer.

After a little work I created multiscr for Windows. I’m sure it is a bit buggy and might not fit to everybody’s liking. After all, I did it only to please myself and not for other peoples consumption. Nevertheless, I’d like to share this, in case someone is interested in using it: Click here to download. A few words of warning though:

  • The screensaver does not use Windows Registry to save user’s choice of screensaver. It saves everything in the %SYSTEMROOT% directory (usually in Windows/System32). So this directory should be writable to the program.
  • Time interval to switch between screensavers should not be less than 10 seconds
  • The program hooks to mouse and keyboard event to stop screensaver when the user makes a mouse or keyboard input (I’m doing everything manually instead of linking directly to Scrnsaver.lib which I personally find quite restrictive. This seems to work quite fine.)
  • The program simulates a mouse (1 pixel movement) event to force the stop of the chosen screensaver to switch to another random screensaver after the given time interval.

I can release the code for free access upon request. At the moment I am not doing so because I need to make the extra work of making the code “better readable”, removing/customizing some of my unnecessary internal codes (which isn’t necessary to share for this program), put in a visual studio project file for ease of compiling and putting some kind of text about license or sharing. At the moment, I’m just too lazy esp. if not a lot of people are interested in the code anyway. Send me a line if you are interested.

19.07.2015

Graphing the Time Stamps

Filed under: Programming — Tags: , , — admin @ 18:04

Remember here where I wrote about a python script that help me time stamp my activities. Now, I had an activity that I also wanted to graphically plot how much time I spent since I started on it. For this, I thought I make use of matplotlib and graph the progress graphically as a days-vs-(minutes spent/day) graph. I already had the csv file created by my time stamper and I wanted to use that data format to do this. But I wanted to have this more general, i.e. I wanted to just drag an drop any csv file created by the time stamping script and see the graph. To do this (I use windows!) I decided to allow window shell to drag and drop file into python scripts. This is done by adding to the windows registry as seen here:


Windows Registry Editor Version 5.00

[HKEY_CLASSES_ROOT\Python.File\shellex\DropHandler]
@="{60254CA5-953B-11CF-8C96-00AA00B8708C}"

Now I can drag and drop csv files created by the stamper into this script to see the progress graph. The result would then look like so

work_graph

Enjoy!

16.05.2015

Time Stamping in Python

Filed under: Programming — Tags: — admin @ 18:35

I have written a script that allows me to time stamp my work during the day. I am sharing it with MIT license  here

I am mostly interested in having my timed activity saved in a csv file that will help me organize my time of the day. The script outputs a csv file with information about the date, time in which work has started, time in which work has ended, time difference of the two and the total time used for the day . So if you timed on for a day and then timed off at another day, then the script will detect it and ask you to give a time when you stopped your work in the day before. It is really merely to record my activity during that day and nothing more.  The script is text-based and if you run it, it will ask if you want to stamp time on or off. If you chose on and then the next time you run it (with the same data file) and ask to time off then it will accordingly do the computation and append the data file. If you chose time on (or time off) two consecutive time, then the script will ask you to first time off (resp. time on) your previous activity.  To run the script, I just place it in my common python library path (I only use Python 2.5 but I guess this would work for any newer version) and then I have a specific script that applied this script as a module in a folder where I have my specific activity. For instance if I have a folder in my PC where I often do my mathematical work, I place a python script with this content in it:

from time_stamp import timestamp
timestamp('./etc/math_timestamp.csv')

where the file ./etc/math_timestamp.csv is the relative filename from the place where the python script is located and where you want your data file (in this case math_timestamp.csv) to be saved. The data file is automatically created if it does not exist (only the directory should exist). Data file should not be tampered with, though it can be opened with any editor that understands csv (or a simple text editor). This allows me to time stamp fragmented  parts of my work while keeping my discipline and track for the amount of work I put for a specific task. For instance, I often would like to do 2 hours of math, 2 hours of chess and a few hours of other work and I use different data files for them (I don’t complete the 2 hours in one go). It definitely has kept me disciplined in the past few months and I have achieved more milestones by it. Simple but effective and yet not so sophisticated like a full fledged UI or something. That’s the way a minimalist like me wants it! :)

Powered by WordPress